How $$$ opportunity drives hiring decisions and enterprise value
In our last post we asked the question “are you ready to expand into Europe?”
After completing the checklist, it’s time to look at some numbers.
Namely, what’s the revenue opportunity? Is Europe a rounding error compared to the US or a major new market?
Without answering this question it’s impossible to make informed decisions about hiring and investment in the region.
When I arrived at Twitter in early 2012 I was faced with just this question. There was almost no revenue coming from the region at that point and there was only a nominal headcount plan with a few heads assigned to the big European countries. It wasn’t clear how big the European business could become. And in the last couple of years I’ve seen many B2B companies struggle with the same question. So here are a few practical approaches you could take:
1. Bottoms-up (productivity)
2. Top-down (TAM)
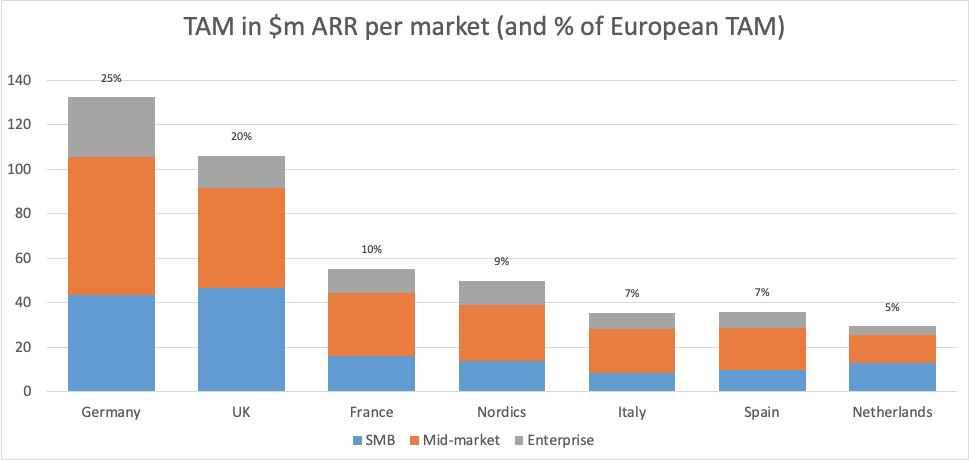
Another approach is to count the number of target customers in each geo and make an assumption about ACV in order to get to the Total Addressable Market. eurostat provides a rich source of country-by-country data broken down by company size (enterprise, mid-market, etc.) and vertical (finance, tech, etc.). Figure 1 below is the result in ARR terms for a real US B2B SaaS company.
3. Rule-of-thumb
(Experience for the win!)
Having spoken to dozens of US B2B software companies that have expanded internationally in recent years, we’ve found one figure to be remarkably consistent:
25–35% of your annual global revenue should be coming from Europe within 5 years.
The majority of companies fall into this band, which gives you a reasonable target to aim for without having to resort to eurostat acrobatics (no offence eurostat, you guys are awesome).
Let’s say your global ARR is $5m today and 5% of it comes from Europe, via self-serve or a rogue AE in the US or whatever. We posit that if you get the big things right in the early days of a European rollout (see our first post) you’ll drive this up to 30% of global ARR within 5 years. Figure 2 below puts these assumptions into numbers by interpolating between our assumptions for Year 0 ($5m global ARR, 5% from Europe) and Year 5 (IPO-track global growth, 30% from Europe) on a curve that is common for high-growth companies that we know have done a good job of landing in Europe:
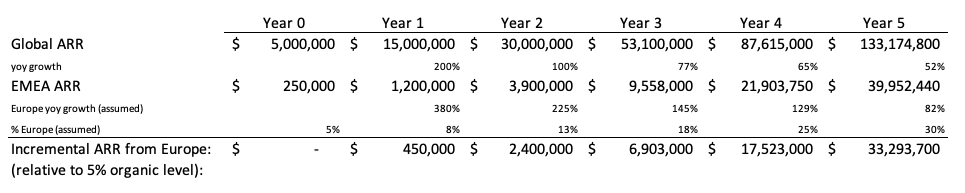
The point of this exercise is not to accurately forecast European revenue; it is to roughly estimate the incremental revenue stream that can be expected from a European operation if it’s invested in properly. In Figure 2, the incremental ARR by Year 5 is $33.3m — a major business in its own right — when compared to the likely ARR if Europe had grown only at the same rate as the company.
Why should any of this matter to a CEO of a Series B or C company? Well, it matters in two ways:
- It informs up-front decisions such as hiring. With a $33.3m ARR new business opportunity available, you should be willing to hire a senior European leadership team in Year 1 rather than testing the market with a couple of sales reps.
- It meaningfully drives enterprise value. The company featured in Figure 2 might well be in an IPO window by the end of Year 5. A European business that’s delivering $40m in ARR and growing faster than the company (82% vs 52%) would be a major valuation driver.
Now that you’ve estimated the revenue opportunity in Europe, you need to figure out how to get your hands on it. For example, although the German market is enormous, it’s notoriously hard for US companies to access. The Nordic countries cumulatively are smaller, but easier to sell into in English. How should you adapt your US go-to-market model for a fragmented Europe? That’s the topic of our next post.